SignalStalker RF spectrum analyzer software turns data collected from spectrum analyzers into graphical charts and displays in real time, enabling users to more readily visualize the RF environment, monitor RF signals, troubleshoot RF issues, and detect sources of RF interference.
SignalStalker offers a variety of diagnostic views of the data captured by an RF spectrum analyzer. Employing multiple views of the data enhances your ability to gain a better understanding of the local, RF landscape in which your wireless network is operating. The table below summarizes some of its features:
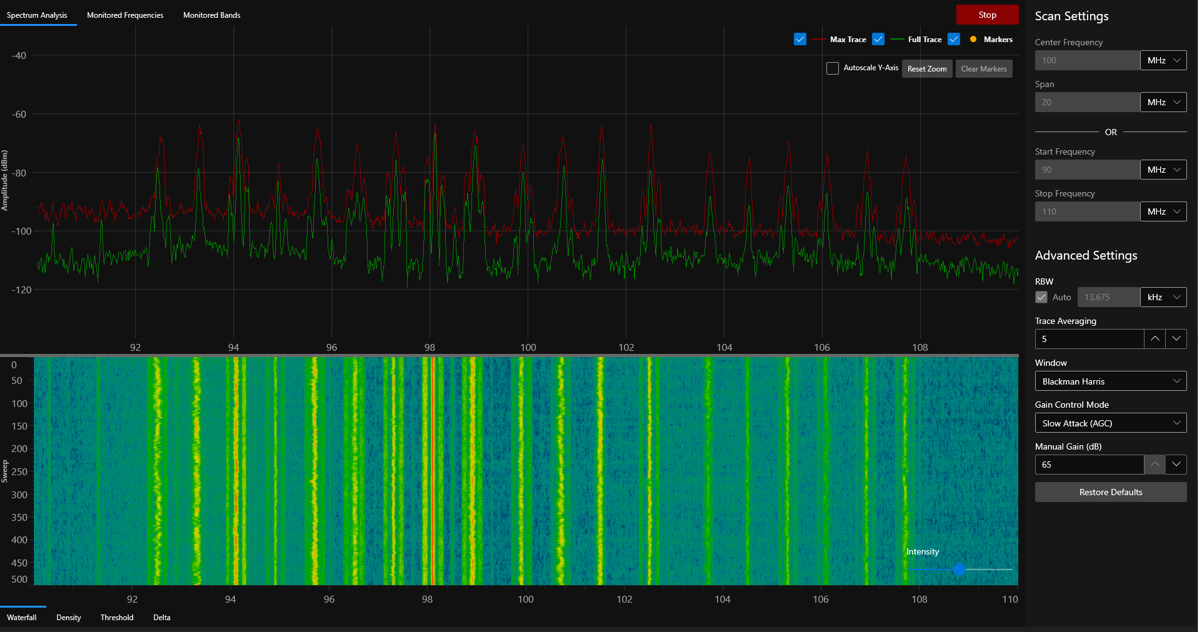
SignalStalker features three different Scan Modes: Spectrum Analysis, Monitored Frequencies, and Monitored Bands.
The Spectrum Analysis charts provide an overall picture of RF energy signals in your environment. As the name suggests, these charts measure all RF energy across a frequency range and chart the signal strength of the frequencies in the range currently being scanned. The Monitored Frequencies and Monitored Bands modes are similar in that they allow you to monitor specific frequencies or bands. For example, in the setting of a live performance where it is important to monitor the channels that have been assigned to wireless audio devices, the Monitored Frequencies feature can be used to ensure those channels are not being impacted by other sources of RF transmissions. Similarly, in a cell-phone free area, the Monitored Bands feature can be used to monitor the frequency bands used by cell phones for the purpose of detecting prohibited transmissions.
Diagnostic Charts
RF Spectrum Trace
Waterfall History / Heatmap
Density Chart
Delta Trace
Threshold Trace
Monitored Frequencies
Monitored Bands