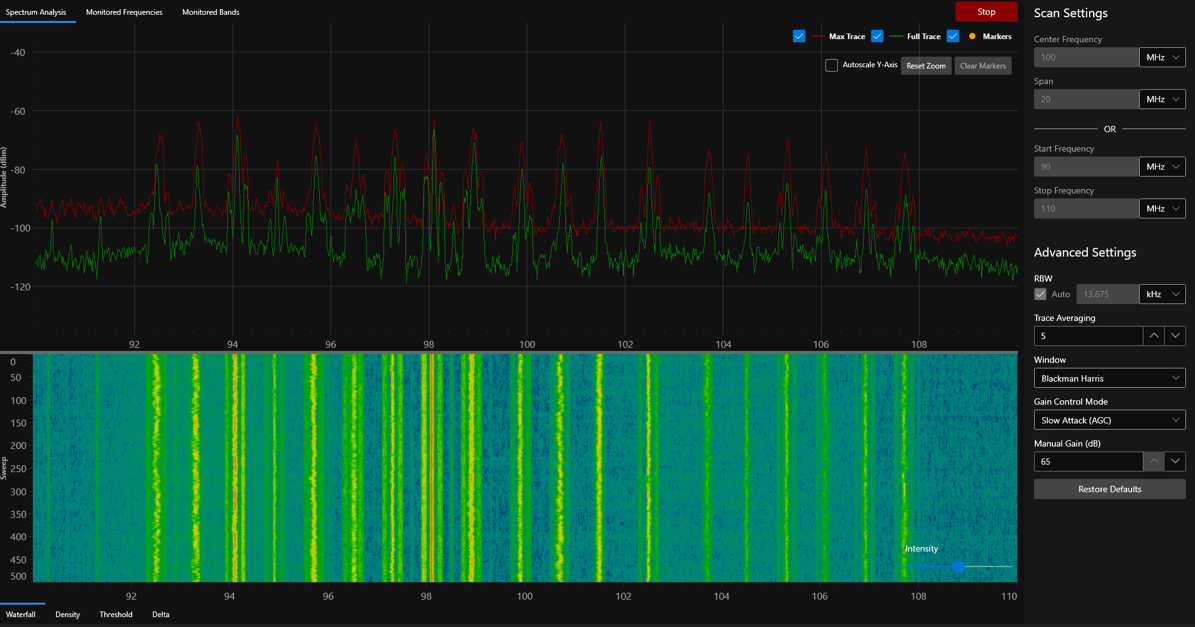
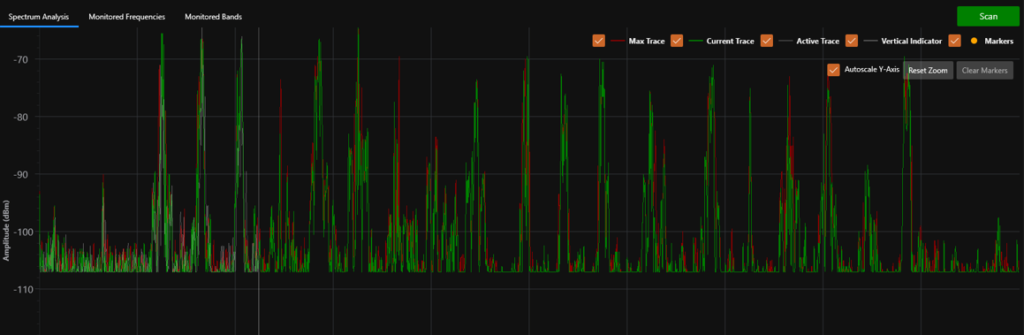
RF Spectrum Trace Continuously scans and samples the signal strength (dBm) of RF transmissions within the specified frequency range. By default 3 traces are displayed — Current (green), Maxima (red) and Active (gray). The Current trace displays the signal strength data from the most recent scan, the Maxima trace displays the maximum signal strength for each frequency since the scan session began (similar to a ‘Peak and Hold’ function), and the Active trace displays real-time data as the RF analyzer device is actively scanning. Optionally, a Reference (blue) trace may also be displayed.
The Max, Current and Active traces can be toggled on / off by checking / unchecking their check boxes.
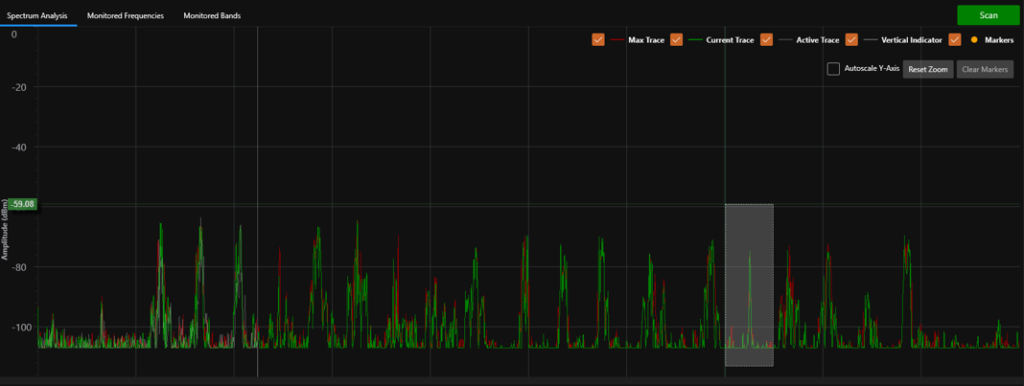
Right-clicking on the spectrum trace draws markers, which can subsequently be cleared using the ‘Clear Markers’ button.
Spectrum traces can be auto-scaled by checking the ‘Autoscale Y-Axis’ check box.
You can zoom portions of the spectrum trace by pressing / holding the right mouse button and creating an outline of the region-of-interest (ROI). When you release the mouse button then the spectrum trace will update to show the ROI. To return to un-zoomed trace, press the ‘Reset Zoom’ button.