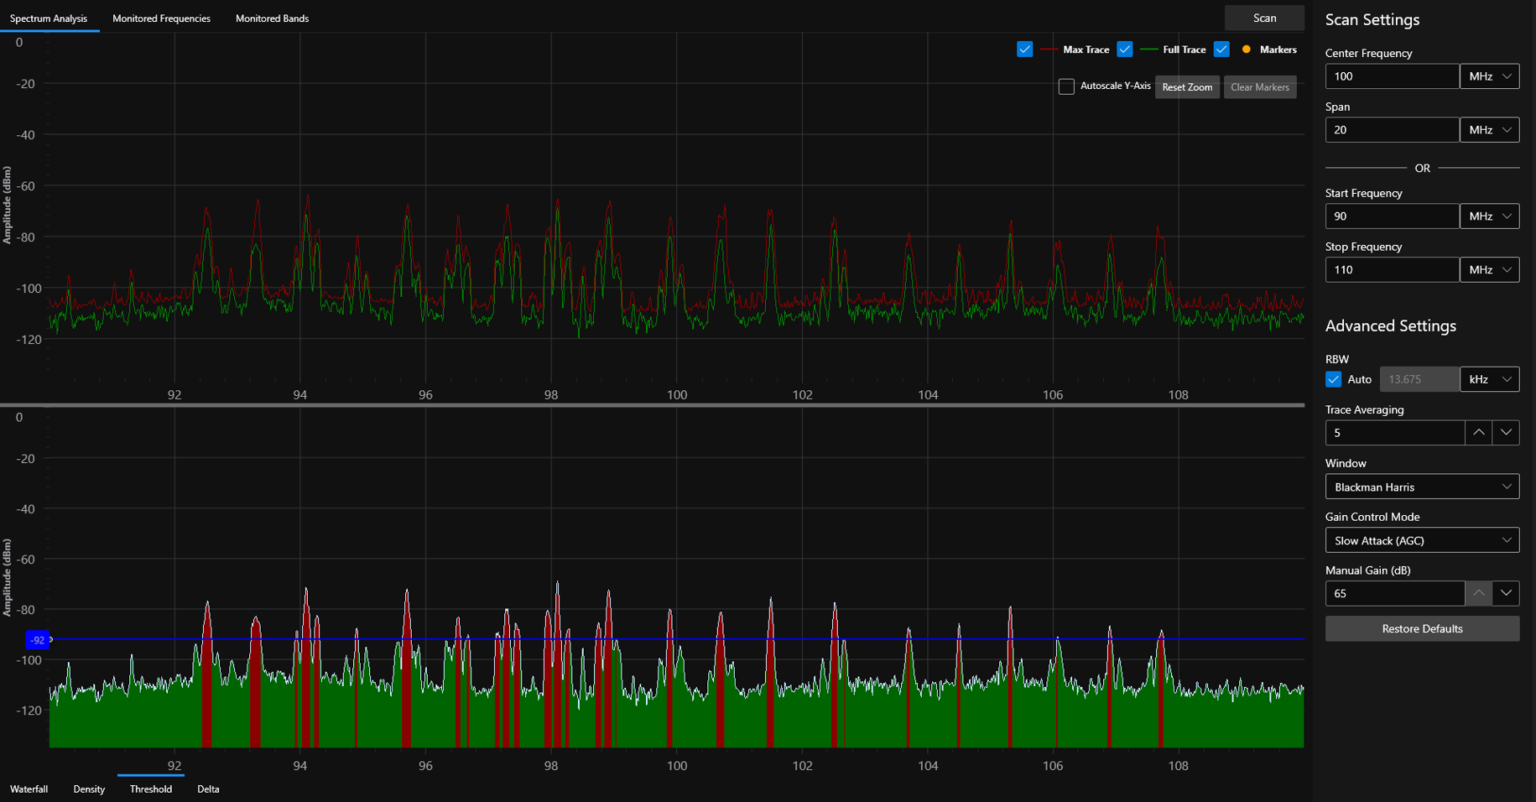
Threshold Trace Similar to the Spectrum Trace view — used to monitor and display RF signals as a function of frequency. However, in addition, this chart highlights with red, vertical lines those frequencies whose signal strength exceeds a user-defined threshold (the blue, horizontal line). This feature is especially useful for visually emphasizing strong signals (and deemphasizing weak ones), where the user gets to define ‘strong’ and ‘weak’ according to where they set the threshold. The blue threshold line is adjusted by selecting and dragging with the right mouse button.